
On a pool page
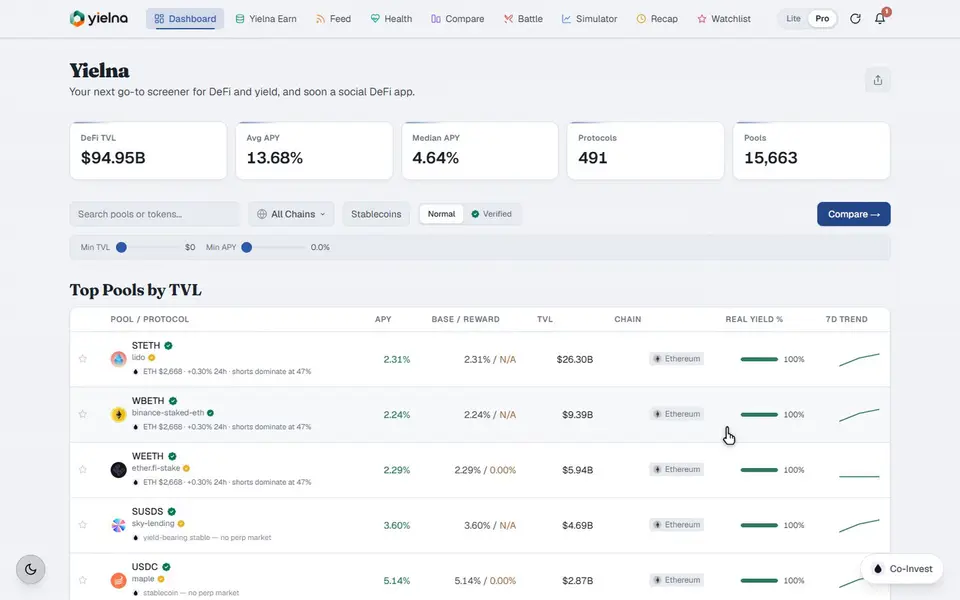
The live price and 24-hour change appear beside the APY, with funding and positioning for the underlying asset shown below. The yield and its market conditions are visible on the same screen.
The market layer
Yielna shows live market data for the asset behind each pool: its price, how crowded its market is, and where leveraged positions are concentrated. All data comes from Liquid's Co-Invest through a read-only connection.
 Co-Invest
Liquid is a multi-asset trading venue. Its Co-Invest interface provides market data including live pricing, funding, open interest and positioning, liquidation levels, order book depth, technical indicators, and asset-linked news. It covers crypto perpetuals, tokenised equities and commodities, and HIP-4 prediction markets.
Yielna uses only the market data. It does not use Co-Invest's order, position or portfolio functions, and its read-only connection cannot access them.
The connection belongs to Yielna. Users are not asked to log in to Liquid, link an account or authorise anything, and there are no per-user credentials. All users see the same market data through the same read-only connection.

Yielna reads data from Liquid but does not trade there and cannot trade on your behalf. The link below is a referral link belonging to Yielna's founder.
Six readings are available. Each is described below, with what a high or low value implies for a yield position.
What the asset trades at right now, and how far it has come today.
The reference point for every other reading. A 12% yield on an asset that has fallen 30% this week is earned on a shrinking base, which the yield figure alone does not show.
The periodic payment that flows between long and short traders on a perpetual market, and which side is paying.
Funding measures how crowded a market is. Strongly positive funding means long positions are paying to stay open, indicating a crowded long side; strongly negative funding indicates the reverse. Funding near zero indicates a balanced market. Heavily skewed funding suggests the underlying asset is exposed to a sharp move if positions unwind.
How open interest is split between long and short, and how one-sided that split has become.
Related to funding but distinct: funding shows the cost of crowding, while positioning shows its extent. In a heavily one-sided market, the crowded side has more positions to unwind, which can accelerate price moves.
The price levels where a meaningful volume of leveraged positions would be forcibly closed.
A cluster is not a price prediction. It shows where a price move could accelerate, because forced liquidations add buying or selling pressure at those levels. It indicates how much room a position has, not whether to take one.
Candlestick history across a timeframe you choose, plus the standard technical set: RSI, MACD, moving averages.
Indicators describe past price behaviour. Yielna displays them without interpretation and does not combine them into a score.
Recent market headlines, mapped to the assets and themes they touch.
Market data shows that a price moved; headlines often explain why. Linking news to each asset keeps that context in one place.
Market readings are attached to assets and appear wherever an asset is shown in the app.
The live price and 24-hour change appear beside the APY, with funding and positioning for the underlying asset shown below. The yield and its market conditions are visible on the same screen.
Each entry includes market context alongside the percentage change, showing what changed and why without opening the pool.
Comparisons include each asset's market conditions as well as its headline rate. Two pools with the same APY can carry very different market risk.
Enter an asset to see its readings immediately. Any chart or liquidation map can be exported as a shareable card, which shows the coin's logo and never a wallet address.
The chatbox accepts questions in plain language and answers from live data. It handles typos and varied phrasing; the examples below are illustrative.
The chatbox is not a language model. It matches questions to a defined set of queries and answers them from live data. It does not hold conversations or generate answers without data.
This is a deliberate choice: every figure it returns comes from a real reading, and when no data is available it says so.
Readings are available only for assets that trade on Liquid. Many DeFi tokens do not, and no funding, positioning or liquidation data exists for them.
In these cases the app states that no data is available. When a wrapped or staked token is shown with its underlying market's data, such as sUSDS with USDS, the substitution is labelled.
This data is neither advice nor a forecast. Funding, positioning and liquidation clusters describe current conditions, not future prices. Yielna does not combine them into a score or a recommendation.
Use it to assess whether the market behind a yield is stable or crowded before depositing.
Open any pool to view live market data for its underlying asset.
Open the app